Aerzen USA technical manager Ralf Weiser explains vibration analysis for condition monitoring of positive displacement blowers and screw compressors.
Access this 6-minute, 52-second video by clicking on the link below.
Aerzen USA technical manager Ralf Weiser explains vibration analysis for condition monitoring of positive displacement blowers and screw compressors.
Access this 6-minute, 52-second video by clicking on the link below.
In simplest terms, vibration in motorized equipment is merely the back and forth movement or oscillation of machines and components, such as drive motors, driven devices (pumps, compressors and so on) and the bearings, shafts, gears, belts and other elements that make up mechanical systems.
Vibration in industrial equipment can be both a sign and a source of trouble. Other times, vibration just “goes with the territory” as a normal part of machine operation, and should not cause undue concern. But how can the plant maintenance professional tell the difference between acceptable, normal vibration and the kind of vibration that requires immediate attention to service or replace troubled equipment?
With a basic understanding of vibration and its causes – and equipped with a vibration testing device – the maintenance professional can quickly and reliably determine the cause and severity of most machine vibration and receive recommendations for repair. It’s all done with the intelligence built into the tester, without the extensive monitoring and recording required for typical, long-term vibration monitoring programs.
Vibration is not always a problem. In some tasks, vibration is essential. Machines such as oscillating sanders and vibratory tumblers use vibration to remove materials and finish surfaces. Vibratory feeders use vibration to move materials. In construction, vibrators are used to help concrete settle into forms and compact fill materials. Vibratory rollers help compress asphalt used in highway paving.
In other cases, vibration is inherent in machine design. For instance, some vibration is almost unavoidable in the operation of reciprocating pumps and compressors, internal combustion engines, and gear drives. In a well-engineered, well-maintained machine, such vibration should be no cause for concern.

When vibration is a problem
Most industrial devices are engineered to operate smoothly and avoid vibration, not produce it. In these machines, vibration can indicate problems or deterioration in the equipment. If the underlying causes are not corrected, the unwanted vibration itself can cause additional damage.
In this article, we are focused not on machines that are “supposed” to vibrate as part of normal operation, but on those that should not vibrate: electric motors, rotary pumps and compressors, and fans and blowers. In these devices, smoother operation is generally better, and a machine running with zero vibration is the ideal.
Most common causes of machine vibration
Vibration can result from a number of conditions, acting alone or in combination. Keep in mind that vibration problems may be caused by auxiliary equipment, not just the primary equipment. These are some of the major causes of vibration.
Imbalance – A “heavy spot” in a rotating component will cause vibration when the unbalanced weight rotates around the machine’s axis, creating a centrifugal force. Imbalance could be caused by manufacturing defects (machining errors, casting flaws) or maintenance issues (deformed or dirty fan blades, missing balance weights). As machine speed increases, the effects of imbalance become greater. Imbalance can severely reduce bearing life as well as cause undue machine vibration.
Misalignment/shaft runout – Vibration can result when machine shafts are out of line. Angular misalignment occurs when the axes of (for example) a motor and pump are not parallel. When the axes are parallel but not exactly aligned, the condition is known as parallel misalignment. Misalignment may be caused during assembly or develop over time, due to thermal expansion, components shifting or improper reassembly after maintenance. The resulting vibration may be radial or axial (in line with the axis of the machine) or both.
Wear – As components such as ball or roller bearings, drive belts or gears become worn, they may cause vibration. When a roller bearing race becomes pitted, for instance, the bearing rollers will cause a vibration each time they travel over the damaged area. A gear tooth that is heavily chipped or worn, or a drive belt that is breaking down, can also produce vibration.
Looseness – Vibration that might otherwise go unnoticed may become obvious and destructive if the component that is vibrating has loose bearings or is loosely attached to its mounts. Such looseness may or may not be caused by the underlying vibration. Whatever its cause, looseness can allow any vibration present to cause damage, such as further bearing wear, wear and fatigue in equipment mounts and other components.
Effects of vibration
The effects of vibration can be severe. Unchecked machine vibration can accelerate rates of wear (i.e. reduce bearing life) and damage equipment. Vibrating machinery can create noise, cause safety problems and lead to degradation in plant working conditions. Vibration can cause machinery to consume excessive power and may damage product quality. In the worst cases, vibration can damage equipment so severely as to knock it out of service and halt plant production.
Yet there is a positive aspect to machine vibration. Measured and analyzed correctly, vibration can be used in a preventive maintenance program as an indicator of machine condition, and help guide the plant maintenance professional to take remedial action before disaster strikes.
Characteristics of vibration
To understand how vibration manifests itself, consider a simple rotating machine like an electric motor. The motor and shaft rotate around the axis of the shaft, which is supported by a bearing at each end.
One key consideration in analyzing vibration is the direction of the vibrating force. In our electric motor, vibration can occur as a force applied in a radial direction (outward from the shaft) or in an axial direction (parallel to the shaft).
An imbalance in the motor, for instance, would most likely cause a radial vibration as the “heavy spot” in the motor rotates, creating a centrifugal force that tugs the motor outward as the shaft rotates through 360 degrees. A shaft misalignment could cause vibration in an axial direction (back and forth along the shaft axis), due to misalignment in a shaft coupling device.
Another key factor in vibration is amplitude, or how much force or severity the vibration has. The farther out of balance our motor is, the greater its amplitude of vibration. Other factors, such as speed of rotation, can also affect vibration amplitude. As rotation rate goes up, the imbalance force increases significantly.
Frequency refers to the oscillation rate of vibration, or how rapidly the machine tends to move back and forth under the force of the condition or conditions causing the vibration.
Frequency is commonly expressed in cycles per minute or hertz (CPM or Hz). One Hz equals one cycle per second or 60 cycles per minute. Though we called our example motor “simple”, even this machine can exhibit a complex vibration signature. As it operates, it could be vibrating in multiple directions (radially and axially), with several rates of amplitude and frequency. Imbalance vibration, axial vibration, vibration from deteriorating roller bearings and more all could combine to create a complex vibration spectrum.
Conclusion
Vibration is a characteristic of virtually all industrial machines. When vibration increases beyond normal levels, it may indicate only normal wear – or it may signal the need for further assessment of the underlying causes, or for immediate maintenance action.
Understanding why vibration occurs and how it manifests itself is a key first step toward preventing vibration from causing trouble in the production environment.
The new Fluke 810 Vibration Tester takes it from there. This advanced handheld device is designed and programmed to diagnose the most common mechanical problems of unbalance, looseness, misalignment and bearing failures in a wide variety of mechanical equipment, including motors, fans, blowers, belts and chain drives, gearboxes, couplings, pumps, compressors, closed coupled machines and spindles.
The Fluke 810 quickly detects vibration along three planes of movement, then provides a plain-text diagnosis with a recommended solution. The diagnostic technology in the Fluke 810 analyzes machine operation and identifies faults by comparing vibration data to an extensive set of rules developed over years of field experience.
Typical vibration analyzers and software are intended for monitoring machine condition over the longer term, but they require special training and investment that may not be possible in many companies. The Fluke 810 is designed specifically for maintenance professionals who need to troubleshoot mechanical problems and quickly understand the root cause of equipment condition.
For more information, visit the Fluke Corporation Web site at www.fluke.com.
Kinetic Systems Inc., a manufacturer of vibration-control workstations and optical tables, offers vibration surveys for new buildings or existing facilities.
To ascertain potentially damaging vibration amplitudes and frequencies in customer facilities, engineers from Kinetic Systems conduct thorough on-site surveys using a portable Fourier analyzer, high-sensitivity accelerometers, and advanced data-acquisition systems. They measure vertical and horizontal vibrations over the required frequency range and average the data over time to produce amplitude and velocity spectra of the facility’s normal vibration levels. Further analysis takes into account the weights, “footprints,” cg (centers of gravity), and expected uses of the devices to be protected, as well as the maximum allowable vibration and other specifications from equipment manufacturers. Kinetic Systems engineers are also trained to perform more advanced testing with impulse-response techniques when necessary. Finally, the data is plotted on graphs (log-scale, narrow-bandwidth spectrums, modified to octave or third-octave bands) and supplied to the customer in a complete report. If vibration control is recommended, the report will detail the degree of protection necessary and how to provide an efficient, cost-effective solution.
Kinetic Systems provides vibration-isolation equipment for high-precision work such as biotechnology research, certain manufacturing operations (optics, semiconductors, etc.), and quality control.
Kinetic Systems is a leader in the design, manufacture, and marketing of vibration isolation equipment, optical tables, and related components. For more information, visit www.kineticsystems.com.
Meggitt Sensing Systems announced the 50th anniversary of the Maryland-based manufacturer of Meggitt’s Wilcoxon Research range of piezoelectric accelerometers and vibration sensors.
Meggitt’s Wilcoxon Research product range was established when Wilcoxon Research was founded as an independent company in 1960. Created by two scientists from the David Taylor Naval Research Center (now the Naval Surface Warfare Center), Wilcoxon Research was founded on two principles that still hold true today: 1) impeccable customer service and customer satisfaction, and 2) continuous contribution to the field of vibration instrumentation through research, development and manufacturing of high-quality, innovative products.
Continuous contribution to the field of vibration instrumentation can be demonstrated throughout the history of Wilcoxon Research. More than 20 unique innovations can be attributed to Wilcoxon Research, beginning in 1961 when the first piezoelectric accelerometer to incorporate an integrally-isolated base was introduced, eliminating the requirement for frequency-limiting adapters. In 1965, Wilcoxon Research pioneered the area of underwater piezoelectric accelerometers and introduced the first accelerometer specifically designed for underwater use.
While naval applications of piezoelectric sensors are still a strong focus, Wilcoxon Research products took a new direction in the 1980s and expanded the development of industrial accelerometers. Through key innovations such as the first piezoelectric velocity sensor in 1983, Wilcoxon Research opened the market for industrial machinery health monitoring. Today, most new designs are for industrial condition monitoring and predictive maintenance applications, and include products that have recently made headlines such as the first stand-alone 4-20 mA vibration displacement sensor for machinery monitoring.
“I am proud to be part of our history of significant contributions to the field of vibration monitoring,” said Derek Carbin, general manager. “And I am honored to lead our ongoing research and development as we continue to advance piezoelectric accelerometers for naval, aerospace, measurement, and industrial condition monitoring uses.”
In 2004, Meggitt PLC, an international aerospace, defense and energy group, acquired Wilcoxon Research. The Wilcoxon Research product range is now managed and marketed by Meggitt Sensing Systems, a brand-new Meggitt division, specializing in sensing and monitoring systems that measure physical parameters in extreme environments. To learn more about the history of Wilcoxon Research, visit http://www.wilcoxon.com/contact_about.cfm.
Do you want to increase profits and reduce maintenance costs for your facility?
It is common knowledge that technologies such as vibration analysis, shaft alignment, oil analysis, thermal imaging, motor circuit testing and several other technologies are excellent tools to help achieve these results. These technologies can be used for the identification and elimination of machinery defects on a daily basis.
Many facilities are content with the knowledge that machinery defects (bearing defects, gearbox defects, etc.) have been identified, scheduled for maintenance and ultimately repaired utilizing these technologies. An optimized reliability program will constantly seek the root causes that create the machinery defects, thereby avoiding many chronic and recurring problems. Most facilities believe that finding the root cause of equipment defects can be difficult. This may be true in some cases, but it is not always the reality. In fact, many of the actual root causes of equipment defects can be easily identified. The elimination of these root causes will reduce the amount of equipment defects that must be repaired over time, help you achieve the goal of reduced maintenance cost and increase profits at your company.
Vibration analysis is a method of finding what forcing function is causing unwanted harmful vibrations and the resulting defects in equipment. However, these defects can be very difficult to distinguish from one another when using only vibration data for identification. If the defect is not accurately identified, then incorrect or unnecessary maintenance may be completed on the equipment as a result. If the root causes are not identified, then the same repair will be repeated over time. All of this increases the overall cost of maintenance and reduces company profit.
Looseness-related conditions are some of the most common issues found in equipment and can be some of the easiest to correct. These conditions, if uncorrected, can create costly routine equipment defects and haunt maintenance staff. This results in continual equipment maintenance and higher repair cost.
Mechanical looseness can be placed into one of two categories:
Structural looseness may act as a vibration amplifier. The stiffness of the equipment or structure changes as the looseness develops and increases in severity. This can allow the resonance frequency to change and overlap with another defect frequency in the machine. This will increase the defect amplitudes and cause the equipment to fail more quickly. Damage due to this effect can be very costly and is completely avoidable.
Structural looseness can be created by base mounting issues, bearing caps, casings, supports, improper/broken welds, etc. These types of conditions are difficult to identify and determine the root cause when using only vibration patterns.
Phase data can often be used to determine the exact problem in the equipment when the vibration data does not provide a clear indication. Phase analysis is one of the most overlooked capabilities that can be used to identify and locate unwanted equipment defects such as structural looseness. Therefore, phase analysis is a very valuable diagnostic tool available to the analyst and can be easily used to identify the root cause of many equipment problems.
It is critical that the analyst have a clear understanding of phase relationships before attempting any type of phase measurements. Phase is the relationship between two events in time. These events may occur in sync (in phase) or out of sync (out of phase) with each other. This distinction is very important and can easily be used to identify structural looseness issues. Phase readings collected on two measurement locations in close proximity to one another should have comparable values. Dissimilar phase values are an indication that the locations are vibrating out of sync (out of phase) with each other and looseness may be present.
Moving the vibration sensor from one radial direction to another (vertical to horizontal) should result in approximately a 90-degree phase shift. Moving the sensor within the same radial direction (horizontal to horizontal or vertical to vertical) should result in approximately the same phase values. It is not uncommon to see a phase shift of approximately plus-or-minus 30 degrees when moving the vibration sensor from one measurement location to another, and this is acceptable.
Figure 1 shows equipment that has been checked for structural looseness. Notice that the measured phase readings remain very similar as the vibration sensor is moved within the same measurement plane. This indicates that no structural looseness issues are present on this side of the machine.
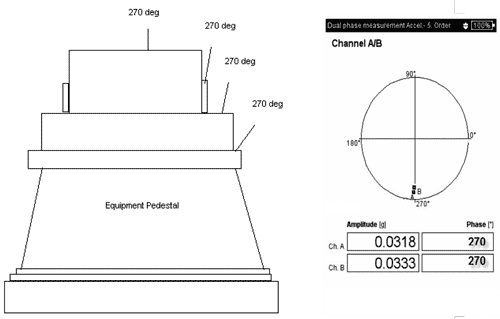
Figure 1. Equipment with no Structural Looseness
Phase should be measured across all bolted or welded joints. Phase readings will suddenly become erratic, from point to point, once a loose component/location is found. Often, the phase shift will change between 90 and 180 degrees from the previous measurement location.
Figure 2 shows a second machine that has been checked for structural looseness. Notice that the phase readings are very similar until a specific measurement location is reached. The phase readings suddenly change. X marks the spot, and the sudden change in phase values indicates a structural looseness issue at the specific measurement location.
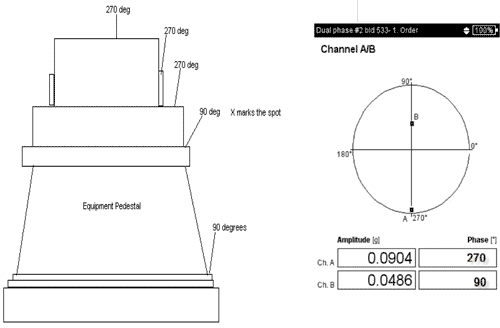
Figure 2. Equipment with Structural Looseness
Phase measurements can be used to identify loose mounting foot conditions in equipment as well (see Figure 3). A loose foot will show a phase shift from the foot to the foundation. Also, a phase difference from the suspect foot compared to the other machine feet should be observed. The phase shift is usually greater than 90 degrees.
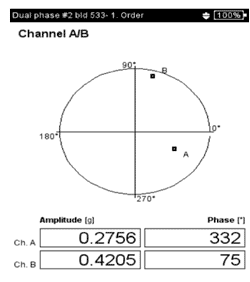
Figure 3.
Another option now available to the analyst is the ability to collect relative phase measurements routinely in a route. This data can be trended over time along with other route-based measurement data (Figure 4). The trend data will show an indication as the equipment condition changes over time. This can be done without a tachometer signal by using a cross-channel phase measurement in the route. In fact, collecting route-based relative phase measurements is an excellent option for machines that have experienced expensive repairs or caused collateral damage due to looseness-related issues. This type of routine information may allow such expensive failures to be avoided and the integrity of the structure or equipment to be maintained.
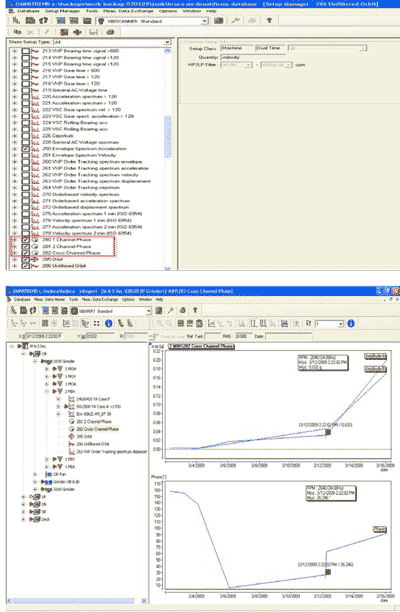
Figure 4.
Proper preparation is imperative prior to conducting any phase measurements. The measurement locations should be clean of dirt, etc. A simple drawing should be created for identifying the desired measurement locations and recording the measured results. This drawing may be simple, but it will prove critical when analyzing the results. Figure 5 shows a simple outline that can be routinely used for phase measurements.

Figure 5. Sample Phase Outline
Basic phase data is not difficult to acquire and can provide a wealth of information. This information will help identify many of the root cause conditions that create equipment defects at your facility. These conditions can be eliminated and, as a result, reduce the amount of routine equipment failures experienced (bearing defects, etc.). This results in overall savings in maintenance costs and increased profits.
If you are expected to reduce maintenance costs and increase profits, do not overlook the technologies you may have available or may purchase. Do not assume that all of the functionality these technologies offer is complicated to use. Not providing these technologies to your maintenance staff or underutilizing the technologies you already have available will actually lead to increased maintenance costs and reduced profits.
About the author:
Trent Phillips is the condition monitoring manager for Ludeca Inc., a vendor of shaft alignment, vibration analysis and balancing equipment. He can be reached at 305-591-8935 or Trent.Phillips@ludeca.com. For additional information, visit www.ludeca.com.
At Alpenrose Dairy in Portland, Ore., operators process the raw milk into a dozen varieties of milk, six cultured products (cottage cheese and sour cream) and 31 flavors of ice cream. It’s a challenge to keep the complex Alpenrose production facility, with its hundreds of motors, pumps and gearboxes, running butter-smooth. But thanks to the new Fluke 810 Vibration Tester, it’s easier today to maintain Alpenrose as the cream of the crop.
This isn’t your average dairy. Family owned and operated since 1916, Alpenrose Dairy Inc. has evolved over time into a community entertainment center that includes Alpenrose Stadium, Dairyville, a replica of a western frontier town, a 600-seat opera house, a Quarter Midget racing arena and an Olympic-style bicycle track.
The hub of this high-profile enterprise is the production plant, churning out dairy products that get to market the day they left the farm. Maintenance manager Eric Trummel and maintenance technician and electric motor expert Todd Toburen keep their fingers on the pulse of the plant.

In the U.S. Navy, Toburen learned vibration analysis to find and diagnose electric motor problems. “We would take our readings and send the data to Annapolis. Annapolis would compile tons of data bouncing off of different frequencies and give us a call back to tell us whether it was good or bad,” Toburen said. “We would rewind and rebuild the motor and retest it, just to make sure what we sent out to the fleet was a good piece of equipment.”
Pumps, motors, gearboxes and more
In his five years at Alpenrose, Toburen has taken charge of the hundreds of pumps, motors, gearboxes, compressors and other equipment required to operate a midsize dairy plant.
“We’ve got equipment here that if it goes down, processing stops,” he said. “If the bad part is a high-dollar item, we don’t have sitting on the shelf. We could be down for a couple of days.”
In the dairy business, where fresh products are essential, such an outage is a non-starter.
To prevent such incidents, Alpenrose manages a more proactive maintenance program to help understand when a motor or machine may encounter problems.
“Our biggest concerns are the pieces of equipment that are critical to the processes,” he said. “If we see that there’s deterioration in the bearings or what have you, we’ll be able to schedule the downtime to take care of that problem.”
But accuracy is key. Trummel recalls an incident when a vibration analysis contractor doing a semiannual check warned of bearing deterioration in an important air compressor.
“He claimed that one of the bearings had gone bad, and that we needed to take care of it in the next couple of months,” Trummel said. “The next week, the coupling on the compressor disintegrated. The air compressor went down, and it represented a limitation of the plant. That’s when I realized these guys may not know what they’re doing. This is why this Fluke 810 is relevant to us. It’s good to have this capability in-house and check this equipment every couple of weeks. We get a better idea and a better feel for what’s going on.”
The handheld Fluke 810 is designed for maintenance professionals who need to troubleshoot mechanical problems and quickly understand the root cause of equipment condition. It’s programmed to diagnose the most common mechanical problems of unbalance, looseness, misalignment and bearing failures in a wide variety of mechanical equipment, including motors, fans, gearboxes, couplings, pumps, compressors and more.
The diagnostic technology in the Fluke 810 analyzes machinery condition and identifies faults by comparing vibration data to an extensive set of rules and algorithms developed over years of field experience. The Fluke 810 is not merely a vibration detector, but a complete diagnostic and problem-solving solution.
“Using the Fluke, we’re able to take a reading once a week or once a month” said Toburen. “If we notice something different, we can build a trend analysis with that data. If we notice there’s a change in our frequencies, that’s something we need to look at. Of course, we won’t be able every single month to do every piece of equipment here at the dairy. We’ll prioritize what equipment we want to check on a monthly or a quarterly basis, and I’m basing that on what my baseline reading is.”
‘The diagnosis was right on’
Machine operators form an important early warning system. If a machine doesn’t feel or sound right to them, Toburen troubleshoots the equipment with the Fluke 810 to see exactly what’s going on.
“The nice thing with this is you’re able to tell, ‘Is it the gearbox? Is it the compressor? Is it the motor? Is it the drive end? Is it the off end?’ It even breaks it down to if you have a loose coupling or not,” he said.
The Fluke 810 also rates the level of severity of any problems it finds.
“It has four different levels,” Toburen said. “Green being slight, yellow being moderate, orange being serious and red being extreme.”
But Toburen said it took some checking to fully trust the opinions of the Fluke 810.
“I had to develop a comfort level with the Fluke’s interpretation,” he said. “I’ve done quite a bit of that. Somebody would come up and say they had a real loud motor. I’d go out and take a vibration analysis on it, and each time I’ve done that it’s come back as ‘extreme.’ The Fluke will actually give you ‘loose bearing’ or ‘bearing wear’ – it will give you the diagnosis. I’ve taken the motors apart, and each time I’ve done it, the diagnosis was right on. Then I’d also rebuild the motor, throw it on the workbench, put the 810 back on it and it comes back as either ‘no problem detected’ or ‘slight wear or vibration.’”
Has the Fluke 810 saved money?
“I don’t know,” said Toburen. “But being able to say there’s something wrong with our equipment, troubleshoot that, get the parts on order, repair it in our downtime and bring it back up online – it’s almost priceless. If you don’t have that part on the shelf it could be two days out, and you’re not doing any processing. The amount you can save? It could be significant.”
For more information, visit the Fluke Corporation Web site at www.fluke.com.
Ludeca Inc., a leading provider of laser alignment and condition monitoring solutions, has launched a blog for maintenance and reliability professionals dedicated to helping companies learn and understand predictive and preventive maintenance technologies such as laser alignment, vibration analysis and balancing. The main purpose of the blog (www.ludeca.com/blog) will be to guide companies on how to effectively integrate predictive maintenance into their maintenance and asset management strategies.
The blog is comprised of alignment and vibration experts, guest authors and technical contributors. "Our team of experts contributes practical applications from field experiences and successes in the maintenance arena. They share industry-specific advice, from basics to the most advanced applications." said Ana Maria Delgado, marketing manager.
The blog will also cover the following categories: articles, Webinars, maintenance tips, industry events, product news related to machinery alignment, vibration analysis and balancing.
Mike Anderson of Newark, Ohio-based Anderson Engineering describes the technologies of a predictive maintenance program and the benefits such a program can bring to the modern factory.
Access this 6-minute, 17-second video by clicking on the link below.
No matter where an asset sits in the plant, the need to understand its health has become increasingly vital. While most facilities continuously monitor their critical machinery, their less-critical assets – often called “essential assets” – cannot typically justify the expense of a traditional continuous monitoring system due to the installation costs of running wires and installing sensors. As such, these assets tend to be addressed with portable data collection programs where operators make rounds at monthly or quarterly intervals, manually collecting data. However, these data collection intervals are rarely satisfactory for essential assets, and problems can progress from “OK” to “serious” from one data collection interval to the next. Or, in some cases, manual data collection is simply not practical or possible due to the nature of the asset – jeopardizing the safety of the employee tasked with collecting data.
To address such challenges and elevate plant reliability, industrial facilities are increasingly turning to wireless. NV Energy highlights this trend with its recent installation of GE Energy’s Bently Nevada Essential Insight.mesh wireless condition monitoring system. The system was installed at the company’s Fort Churchill Operating Station in Yerington, Nev., with the goal of reducing operating expenses and increasing reliability.
Before the installation of Essential Insight.mesh, these assets were only infrequently monitored by a walk-around program. The wireless condition monitoring systems help to improve overall plant reliability and efficiency by extending condition monitoring to a broader array of essential assets that were previously underserved and classified as mid- to low-criticality.
“We were excited to be the first plant in NV Energy to utilize this new technology,” says Greg Bushman, plant manager at Fort Churchill. “We have always used Bently Nevada condition monitoring for our critical assets, so it seemed like a natural fit to extend this to our essential assets, as well.”
Over the course of two days, the entire wireless system was deployed and configured on a wide range of rotating machines, including boiler feed pumps, condensate pumps, AC lube oil pumps, service water pumps, circulation water pumps and an FD fan. The system consisted of 21 vibration sensors, seven wSIM nodes, three Repeaters and System 1 software.
The system began returning useful information almost immediately as anomalies were detected on cooling water pumps and confirmed the need to plan and schedule repairs.
Because the data from these assets is transmitted wirelessly to the plant’s Electronics Room, where a System 1 display computer is located, it is now within easy reach of plant operators and is integrated with all of the data from other monitored assets, such as the plant’s critical turbine-generator sets.
This provides operators with plant-wide analysis and insight capabilities on the mechanical condition of their assets, allowing data-driven decisions and thus reducing costs of plant operations and maintenance. Armed with these benefits, and the considerably lower costs of installation and deployment that wireless technology affords, customers can more confidently and easily justify expansion of online condition monitoring to a broader spectrum of assets in their plants, such as remote deep-well pumps, cooling towers and more.
By helping plants extend affordable, online monitoring to more asset types, they can operate smarter – increasing efficiency, reliability, and uptime, which can translate to a reduction in operating expenses.
For more information on GE Energy products and services, visit:
http://www.gepower.com/prod_serv/products/oc/en/bently_nevada/essential_insight.htm
Azima DLI, the leader and premier provider of predictive machine condition monitoring and analysis services, on June 21 announced that its advanced vibration monitoring capabilities will be used by the Panama Canal Authority (ACP) to achieve important equipment reliability and uptime goals associated with the operation of its lock system. The ACP is the autonomous agency of the Government of Panama in charge of managing, operating and maintaining the Panama Canal.
The Panama Canal is in constant operation, so uptime of critical equipment, such as the motors and hydraulic pumps used to ensure the locks operate as they are supposed to, is vitally important to the commercial and private vessels that rely on the Canal every day. Of the three locks, Miraflores was the first to select, through a public bid (provided through Azima DLI’s Central American distributor Termogram), the Azima DLI DCX, a rugged, four channel vibration data collector and real-time analyzer. Miraflores Locks’ maintenance unit will use the Azima DLI vibration data collectors after training is complete. Termogram can provide the onsite training and support.
The Panama Canal locks have long been recognized as significant engineering accomplishments. All lock chambers have the same 110 by 1,000 feet dimensions, and they are built in pairs. That means two lanes of chambers run side-by-side to accommodate two lanes of traffic, either in opposite directions at the same time or in the same direction, depending on transit needs. To make sure the locks are performing as needed, the ACP’s Miraflores Locks’ maintenance unit will collect all its own data using the DCX to take vibration measurements on Miraflores’ 200 motor pump groups (MPGs), which include gates, valves, locomotives and other motors throughout the plant.
“Our maintenance program includes thermography, remote visual inspection, oil analysis and vibration, which is an important component of measurement,” said Miraflores Locks maintenance manager Carlos Patterson.
The Windows-compatible Azima DLI DCX allows vibration analysts to record, collect and analyze vibration information directly from a military-grade Tablet PC that features embedded ExpertALERT vibration analysis software. Azima DLI’s ExpertAlert software allows analysts to have all their machinery history, analysis tools and automated diagnostic results at the point of data collection, supporting timely maintenance and repair decisions.
“In the case of the Panama Canal, although MPGs are redundant in the lock machinery, failure avoidance is of utmost importance. If the MPG redundancy fails, the lock doors don’t open, causing delays with Canal traffic,” said Azima DLI’s Director of International Sales Ron Sullivan. “Due to the critical nature of its operations, the Panama Canal Authority is a leader in developing effective machine condition monitoring programs, maximizing the use of critical software to ensure its equipment is in peak condition. We are proud that Azima DLI’s DCX data collector and ExpertAlert diagnostic software will become important components of the maintenance team’s overall program.”
About Azima DLI
Azima DLI is the leader and premier provider of predictive machine condition monitoring and analysis services that align with customers’ high standards for reliability, availability and uptime. Azima DLI’s WATCHMAN Reliability Services utilize flexible deployment models, proven diagnostic software and unmatched analytical expertise to deliver sustainable, scalable and cost-effective condition-based maintenance programs. The company’s bundled solutions enable customers to choose comprehensive, proven programs that ensure asset availability and maximize productivity. Azima DLI is headquartered in Woburn, Massachusetts with offices across the U.S. and international representation in Asia-Pacific, Central America, Europe and South America.
Data collection is the backbone of any vibration monitoring effort, yet opportunities to gather additional data while at the machine are typically ignored. Is the vibration industry finally beginning to feel the effects of the pure data collector who has not transitioned into the reliability group from the mechanical trades? What about the site operators and craftsman? This paper covers basic inspection techniques that can be applied to optimize time spent in the field.
Introduction
Many organizations separate personnel who perform technology monitoring into a predictive maintenance (PdM) team or reliability group. Their job is to periodically collect machinery information using various forms of technology and use this data to assess the condition of the machine.
Different technologies exist for monitoring the condition of mechanical and electrical components, and especially for detecting impending failure. Each technology has it own applications, advantages and disadvantages. Effective condition monitoring makes use of multiple techniques and technologies.
An under-utilized group of checks that provide valuable data are basic visual, audible and tactile inspections. These inspections can be performed and used to supplement the formal technology inspections. The key to successful implementation of a visual, audible and tactile inspection program is training the participants on the basic operation of the component to be inspected and following a list of items to be checked.
Condition monitoring steps
Effective condition monitoring programs consist of four major elements:
It is important to thoroughly understand each of these elements. Valuable time is too often wasted when too much emphasis is placed on any one component.
Detection
Many problems can be found using visual, audible and tactile inspections. The goal is to identify bad machines or identify deteriorating conditions. The question becomes how to quantify the results of these inspections. Technologies like vibration, thermography, ultrasound, oil analysis and motor circuit testing may be used.
After identifying machines in need of further analysis using detection, the next step is to determine the root cause of the problem. This is achieved during the analysis phase.
Analysis
The purpose of performing an analysis is to determine the root cause of the problem. The analysis phase involves studying the machine’s operation, defect characteristics, maintenance history, etc. Only the machines indicating problems should be analyzed. Once the analysis is complete and the root cause of the problem found, the results should be communicated.
Correction/Improvement
After determining the root cause of the problem, it can be corrected. The most common problems require balancing and/or precision alignment. In order to maximize the reliability of the machine in question, it is also advisable to improve the source causing the asset to be in exception. This will extend the life of the machine. We at Universal Technologies emphasize that the incremental time required to improve the machine is small compared to the costs of the unanticipated machine downtime and the maintenance process.
Verification
After determining the root cause of the problem, correcting the problem and improving the machine, it is important to verify that the correction or improvement has occurred. One mechanism for this verification is comparing before values to the original baseline data.
Other common verification methods include:
Figure 4. Correction Verification
Visual inspections
One of the simplest, but often neglected, forms of condition monitoring is visual inspection of machinery. While this is subjective, you can often gain a good “gut feel” for where the problem is most severe. But remember, the root cause cannot be determined in this manner.
Effective visual inspection procedures include examination of the machine and surrounding area for each of the following:
Audible inspection
Another simple form of condition monitoring is audible inspection of machinery. While this is also subjective, you can often gain a good “feel” for the area where the source is originating. But remember, the root cause cannot be determined in this manner. The use of stethoscopes, sounding rods and other listening devices can enable an experienced practitioner to detect such problems as rubs, bearing defects, cavitation, etc.
When listening to a machine, try to determine if the sound is complex or simple, high frequency or low frequency, and from where the sound appears to be coming.
Effective audible inspection procedures include examination of the machine and surrounding area for the following:
Tactile inspection
To hand-feel a machine for excessive vibration, perform the steps below:
Other tactile observations should be performed as well. Effective tactile inspection procedures include examination of the machine and surrounding area for the following:
Enhancing visual inspections with spot radiometers
Infrared thermometers measure the amount of infrared energy emitted by a target object and calculate the temperature of that object’s surface. Typical features include laser sighting, adjustable emissivity, alarm functions and trigger locks. Other features may include data loggers and graphic displays, thermocouples, and software interfaces.
It should be noted that the temperature reading is the outer surface temperature of the first surface the laser beam penetrates. If taking a reading through Plexiglas or other transparent material that the laser penetrates, the temperature reading will represent the Plexiglas surface only.
Limitation – emissivity: Emissivity is ability of a material to reflect heat. Different materials have different emissivity values and must be accounted for when attempting to obtain an absolute temperature reading. For comparison readings, emissivity is less of an issue provided that the two target materials are the same. If there is a need for accurate absolute temperature measurement, then the contact thermocouple provided should be used to cross-check the infrared data. Your instrument has functions that allow you to select the correct emissivity value for the target material, but for the intent of this article and general instrument use, the “free” setting will be used.
Limitation – measurement spot size: The measured spot size depends on the distance between the object you are measuring and the infrared thermometer. This will vary depending on manufacturer and by models from the same manufacturer. Note that the temperature is an average of the temperatures contained within the spot circle. Move closer to the target to get a smaller measurement area.
Strobe lights
Visual inspection of rotating assets in conjunction with using a strobe light allows other components to be evaluated.
Precautions and safety:
Summary
Performing visual, audible and tactile inspections can provide tremendous value when integrated into an overall reliability effort. Formalizing and documenting inspections that are being performed by non-PdM technicians will allow data to be utilized by everyone.
The acceptance of integrating technologies to gain a better picture of equipment condition is widely accepted. Why not use this same model to leverage information from personnel who traditionally are not viewed as having an active role in reliability? Many times, operators and maintenance personnel can provide that “missing piece” of information that cannot be seen by the PdM technician when viewing equipment on a monthly or quarterly cycle.
How many organizations would jump at the chance to add dozens of additional personnel to the reliability effort without adding additional cost? By training and engaging operators and maintenance personnel, that is exactly what is possible.
References
This paper was presented at an annual Noria Corporation conference. For more information on this year’s event, visit http://conference.reliableplant.com.
About the author:
Lance Bisinger is the Americas operations manager at GPAllied, a reliability and operations consulting and services company. For more information, visit www.gpallied.com.
Alan Richardson, president of Preventive Vibration Analysis Corporation, explains the importance and benefits of vibration analysis.
A four-day Machine Vibration seminar with hands-on practical experience will be held on July 20 through 23 in San Jose, Calif. Attendees can become certified as Level I vibration analysts by taking a test on the last day.
Analyzing the vibration of rotating and reciprocating machinery provides an early warning system that alerts maintenance and reliability managers to machine health problems to help avoid costly, sudden breakdowns. Datastick’s handheld VSA Vibration Spectrum Analyzer will be used in the training.
The four-day seminar includes hands-on practice as well as training on the basics of vibration, such as: what is an FFT; waveform vs. spectrum; an introduction to spectrum analysis; when and how to use the displacement, velocity and acceleration domains; and how to set up and manage inspection routes. Also covered are: effective sensor placement, onsite troubleshooting, detection of unbalance, eccentric rotors, gear wear and bearing failure, as well as how to measure vibration, create reports, and analyze the results to determine the likely cause of machine function problems such as resonance, rotor bar issues, and more. A full agenda can be found at www.datastick.com/training.
Today, predictive maintenance and Reliability-Centered Maintenance programs are replacing run-to-failure methods – as well as preventive maintenance methods that were based on taking a piece of equipment offline for costly service, regardless of condition, after a certain number of hours of use.
“Hands-on practical experience is important to effective training, and this seminar provides it,” said Penny Melrose, CEO of Datastick Systems. “The Datastick VSA is an excellent tool for someone new to vibration because of its extremely fast learning curve and exceptional ease of use, along with full analysis comparable to or better than some analyzers at more than double the cost.”
The course and exam meet the ISO 18436-2 and the American Society of Nondestructive Testing (ASNT) SNT-TC-1A standards.
About Datastick Systems Inc.
Datastick Systems is a leading provider of cost-effective, innovative handheld vibration analysis and portable machine balancing systems. Companies around the world rely on our solutions to maintain the reliability and uptime of their machinery. Datastick Systems is headquartered in San Jose. For more information, visit www.datastick.com.
This video outlines a new low-cost system for non-destructive testing and measurement, including vibration analysis, of materials and components.
Ah, to be able to predict the winning numbers in a lottery – who hasn’t had that dream! Life would be so easy and carefree with a crystal ball. And, would not your maintenance job be so much simpler if you could just identify machine damage in time and predict the point at which repairs really become necessary?
According to DIN 31051, condition-oriented maintenance is not limited to inspection, servicing, determination of the machine condition and maintenance scheduling. It also encompasses predicting the length of service life remaining for machines and systems. This means it is not always necessary to replace a rolling bearing when an inspection measurement reveals inner raceway frequencies.
This article describes how it was possible to keep a damaged bearing running for several months until the scheduled annual outage came around – naturally under close observation. Periodic measurements had shown that there had only been a slight change in the envelope spectrum. But one thing at a time …
In January, a contractor was awarded a contract for the mobile condition measurement of a double-shaft extruder gear. So, before the diagnostic specialist carries out measurements on location, the gear construction data is established by way of the factory number and the bearing frequencies are calculated for the entire drive (Figure 1).

Figure 1
For this purpose, the contractor used a computer program that recognizes almost all gear types, including variable speed drives. Having calculated the excitation frequencies, the diagnostic specialist visits the customer to determine the current condition of the drive – which in this case was already 7 years old – and to find any deviations. Beginning bearing damage was identified during control measurement as a result of the distinct, albeit not yet critical, vibrations of an inner raceway frequency that were picked up in the input shaft area. The gear condition was recorded and the recommendation to procure replacement parts for the intermediate shaft was made to the operator. Repeated monthly measurements were recommended to assess whether the bearing needed to be replaced.
Figure 2 shows two envelope spectra that were recorded three months apart at the same measuring point.

Figure 2. Measured Values Recorded at a Three-month Interval
Because changes were only slight, an immediate replacement of the bearing was not deemed necessary, and the decision was made to continue operation until the scheduled annual outage. The bearing was exchanged five months later.

Figure 3. Dismantling the Intermediate Shaft
Upon dismantling the bearing, the damage diagnosed on the inner raceway could be confirmed as expected – nine months after initial diagnosis. Pittings are clearly visible on the inner raceway.

Figure 4. Inner Raceway with Diagnosed Pitting
The extruder was back in operation two days later as planned.
In hindsight, both the diagnosis and the predicted remaining service time proved to be correct and economically wise. Expensive “crash repair” was unnecessary in this case. And, avoiding downtime was almost like picking a “winning number” in the lottery.
About the author:
Mickey Harp is a vibration application engineer for Ludeca Inc. Ludeca is the exclusive distributor and factory-authorized service and training center for PRUFTECHNIK alignment systems and condition monitoring products in the United States, the Caribbean and Venezuela. It is also the manufacturer and distributor of DotLine Laser and SheaveMaster Pulley alignment tools. The author can be reached at 305-591-8935 or Mickey.Harp@ludeca.com. For additional information, visit www.ludeca.com.
GTI Spindle reveals its new vibration analyzer built on the iPad mobile computing platform.
Arch Coal Inc. on September 22 announced that its predictive maintenance program has been named as the best overall program among mobile equipment fleets from around the world by an industrial trade magazine.
"Earning the best predictive maintenance award is an important achievement for Arch Coal's national network of mines," said John W. Eaves, Arch's president and chief operating officer. "The mining environment is very dynamic, which makes the maintenance of equipment an intense and challenging effort. That's why our mining personnel value the recognition for their best-in-class practices that include managing risk and reducing exposure through planned, preventative and predictive maintenance."
Arch Coal's predictive maintenance program employs certified maintenance engineers at each mining complex and standardized processes to provide comprehensive oil and vibration analysis, ultrasonic flaw detection, thermography and motor circuit analysis. This technology is used for quality standards and acceptance testing at component and rebuild facilities certified by Arch. According to Arch's director of technical and maintenance services, Bob McCreary, Arch has reduced controllable maintenance costs by 5 percent annually over the last four years by integrating a comprehensive predictive maintenance program throughout its national network of mines.
St. Louis-based Arch Coal, Inc. is the nation's second-largest coal producer. The company's core business is providing U.S. power generators with clean-burning, low-sulfur coal for electric generation. The company also ships coal to domestic and international steel manufacturers as well as international power producers. Through its national network of mines and 4,600-person workforce, Arch supplies the fuel for approximately 8 percent of the electricity generated in the United States.
Emerson Process Management, a leader in wireless technology for mainstream process manufacturing, has expanded the capabilities of its CSI 9420 Wireless Vibration Transmitter to deliver more detailed information for machinery analysis. In addition to sending operators direct alerts on high vibration caused by faults like cavitation or bearing defects, the CSI 9420 can now also use Emerson's reliable Smart Wireless network to send high resolution spectra to vibration experts for detailed diagnosis of machinery issues.
The CSI 9420 connects quickly, easily and economically to any machine. Its wireless capabilities are especially beneficial for equipment that is in remote or hard-to-reach locations, is inadequately monitored, and needs more visibility to operations and maintenance personnel.
The CSI 9420 has been proven cost-effective in a wide range of applications across all industries. For example, it presents an excellent solution for monitoring refinery pumps, protecting against not only production loss but also health and safety risks from fugitive emissions. Other key uses include monitoring of cooling towers, compressors, and agitators in settling ponds as well as all types of motors, pumps, and fans.
Vibration information delivered wirelessly by the CSI 9420 includes velocity and PeakVue stress wave values. Configuration, diagnostics, and alerts from the CSI 9420 are available in Emerson's AMS Suite predictive maintenance software, while vibration data can be correlated with other process variables in the company's DeltaV and Ovation digital control systems as well as other suppliers' data historians or control systems. The CSI 9420 has a user-configurable interface to report high resolution spectra and waveforms as well as vibration energy bands for enhanced trending and alarming.
"Emerson is committed to providing our customers with Smart Wireless offerings that increase safety, reliability and uptime – absolute priorities for our users," said Stuart Harris, vice president and general manager of the Asset Optimization business. “By significantly enhancing wireless predictive diagnostics for essential machinery, we enable our customers to expand their monitoring programs to address these key business priorities.”
Smart Wireless extends the benefits of Emerson’s PlantWeb digital plant architecture to areas of the plant that were previously out of physical or economic reach. In addition to the wireless vibration transmitter, Emerson offers a wide range of wireless field instrumentation and plant operations technology, including Fisher position monitors, Rosemount transmitters, Rosemount Analytical and Machinery Health Management devices, and native wireless interfaces to AMS Suite predictive maintenance software, DeltaV or Ovation digital automation systems, and wireless SmartStart services.
For more information about Smart Wireless, visit www.EmersonProcess.com/SmartWireless, and for videos go to www.EmersonSmartWireless.com/videos.
Azima DLI, a provider of predictive machine condition monitoring and analysis services, announced September 29 that its ExpertALERT automated diagnostic system (ADS) technology was selected by Fluke Corporation, a leader in portable electronic test and measurement technology. Fluke chose ExpertALERT’s ADS to power the rapid diagnostic capabilities featured in the Fluke 810 Vibration Tester, its newest, most advanced troubleshooting tool. Now, resource-constrained plants can anticipate machinery problems, address recurring failures and bridge the personnel skills gap required for effective vibration monitoring programs.
The Fluke 810 is a portable, handheld device ideal for troubleshooting industrial plant equipment such as motors, gearboxes, pumps and compressors. The Fluke 810 allows maintenance professionals to quickly identify existing and developing causes of mechanical failures including bearing problems, misalignment, imbalance and internal looseness. The Fluke 810 captures vibration data and processes it using the ExpertALERT ADS technology, then quickly translates the data into easy-to-understand and highly-accurate machine fault diagnoses. The combined solution provides users with a simple step-by-step process that helps assess machinery health, troubleshoot and prioritize mechanical problems without requiring expertise in data collection or vibration analysis.
“In the process of developing the Fluke 810, we surveyed the market for expert systems that could provide the diagnostic benefits our customers needed to effectively troubleshoot machine problems. Azima DLI had the answer,” said Barbara Hulit, president of Fluke Corporation. “By combining Azima DLI’s vibration data and software technology with our engineering and industrial design, we could make expert vibration diagnoses immediately available to maintenance professionals everywhere.”
The software technology embedded in the Fluke 810 is similarly deployed in thousands of advanced ExpertALERT, Azima DLI DCX and SpriteMAX systems in manufacturing, petro-chemical, pharmaceutical, water/wastewater, transportation and power generation companies, as well as the U.S. military. For plants that have realized the value of mechanical troubleshooting and are interested in implementing a more extensive plant-wide machine condition monitoring program, choosing Azima DLI’s WATCHMAN Reliability Services is often a logical next step to expand the benefits of a vibration analysis program without having to invest in additional equipment, software, training or personnel.
“The Fluke 810 is an excellent tool to introduce vibration analysis to plants that don’t have established programs. We believe this relationship has the potential to expand the vibration market by increasing recognition of vibration analysis as an important element of comprehensive predictive maintenance programs,” said Burt Hurlock, CEO, Azima DLI. “With an innovative technology partner like Fluke, Azima DLI also has the opportunity to raise the visibility of our diagnostic software and expand the footprint of WATCHMAN Reliability Services in new vertical markets and geographies.”
About Fluke
Fluke Corporation is a leader in compact, professional electronic test tools. Fluke customers are technicians, engineers, electricians, metrologists and building diagnostic professionals who install, troubleshoot, and manage industrial electrical and electronic equipment and calibration processes for quality control as well as conducting building restoration and remediation services.
About Azima DLI
Azima DLI is a leader and premier provider of predictive machine condition monitoring and analysis services that align with customers’ high standards for reliability, availability and uptime. Azima DLI’s WATCHMAN Reliability Services utilize flexible deployment models, proven diagnostic software and unmatched analytical expertise to deliver sustainable, scalable and cost-effective condition-based maintenance programs. The company’s bundled solutions enable customers to choose comprehensive, proven programs that ensure asset availability and maximize productivity. Azima DLI is headquartered in Woburn, Mass., with offices across the U.S. and international representation in Asia-Pacific, Central America, Europe and South America.
Vibration analysis is mostly a learned skill. It is based 70 percent on experience and 30 percent on classroom training and self study. It takes years to become a confident and competent vibration analyst. When the analysis is wrong, the recommendations for repair also will be incorrect. No vibration analyst wants to make the wrong call. In this business, credibility is gained in small steps and lost in large chunks.
A vibration sensor placed on a bearing housing and connected to a vibration analyzer provides time, frequency and amplitude information in the form of a waveform and a spectrum (Figure 1). This data is the foundation for vibration analysis. It contains the signatures of nearly all mechanical and electrical defects present on the machine.
Figure 1. Vibration Waveform and Spectrum
The vibration analysis process involves determining the vibration severity, identifying frequencies and patterns, associating the peaks and patterns with mechanical or electrical components, forming conclusions and, if necessary, making recommendations for repair.
Everybody involved in vibration analysis knows that analyzing vibration is not easy nor automated. Have you ever wondered why? Here are a few reasons:
1) Machines Have Multiple Faults: The vibration patterns we learn in training and read about in books just don’t look the same in the real world. We learn how mechanical and electrical faults look in the purest form – as if there was always only that one problem on the machine causing vibration. Machines usually have more than one vibration-producing fault. At a minimum, all machines have some unbalance and misalignment. When other faults develop, the waveform and spectrum quickly become complicated and difficult to analyze. The data no longer matches the fault patterns we have learned.
2) Cause and Effect Vibration: For every action, there is a reaction. Some of the vibration we measure is the effect of other problems. For example, the force caused by rotor unbalance can make the machine look like it is out of alignment, loose or rubbing. Consider all of the things that shake and rattle on your car when one tire goes out of balance.
3) Many Fault Types Have Similar Patterns: Because machine rotors rotate at a particular speed, and vibration is a cyclical force, many mechanical and electrical faults exhibit similar frequency patterns that make it difficult to distinguish one fault from another.
Learning to analyze vibration just takes time. Training courses, technical publications and other resources such as online resources and commercial self teaching material are available that can improve analysis skills and shorten the learning curve.
There is one diagnostic technique which quickly gets to the source of most vibration problems. It is possibly the most powerful of all vibration diagnostic techniques. It has been around as long as vibration analysis itself yet hasn’t gotten a lot of attention, and it’s rare to find good information about the subject. What is this technique? It’s called phase analysis.
What is Phase?
Phase is the position of a rotating part at any instant with respect to a fixed point. Phase gives us the vibration direction. Tuning a car engine using a timing light and inductive sensor is an application of phase analysis (Figure 2).
Figure 2. Engine tuning using a timing light is phase analysis.
A phase study is a collection of phase measurements made on a machine or structure and evaluated to reveal information about relative motion between components. In vibration analysis, phase is measured using absolute or relative techniques.
Absolute phase is measured with one sensor and one tachometer referencing a mark on the rotating shaft (Figure 3). At each measurement point, the analyzer calculates the time between the tachometer trigger and the next positive waveform peak vibration. This time interval is converted to degrees and displayed as the absolute phase (Figure 4). Phase can be measured at shaft rotational frequency or any whole number multiple of shaft speed (synchronous frequencies). Absolute phase is required for rotor balancing.
Figure 3. Absolute Phase Measurement
Relative phase is measured on a multi-channel vibration analyzer using two or more (similar type) vibration sensors. The analyzer must be able to measure cross-channel phase. One single-axis sensor serves as the fixed reference and is placed somewhere on the machine (typically on a bearing housing). Another single-axis or triaxial sensor is moved sequentially to all of the other test points (Figure 5). At each test point, the analyzer compares waveforms between the fixed and roving sensors. Relative phase is the time difference between the waveforms at a specific frequency converted to degrees (Figure 6). Relative phase does not require a tachometer so phase can be measured at any frequency.
Figure 5. Relative Phase Measurement
Figure 6. Relative Phase Calculated Between Two Vibration Waveforms
Both types of phase measurements are easy to make. Relative phase is the most convenient way to measure phase on a machine because the machine does not need to be stopped to install reflective tape on the shaft. Phase can be measured at any frequency. Most single-channel vibration analyzers can measure absolute phase. Multi-channel vibration analyzers like the Pruftechnik VibXpert illustrated in Figure 7 have standard functions for measuring both absolute and relative phase.
Figure 7. Pruftechnik VibXpert 2-Channel Vibration Analyzer
When to use Phase Analysis
Everyone needs phase analysis. A phase study should be made on problem machines when the source of the vibration is not clear or when it is necessary to confirm suspected sources of vibration. A phase study might include points measured only on the machine bearings or it can include points over the entire machine from the foundation up to the bearings. The following are examples of how phase can help analyze vibration.
Soft Foot
The term soft foot is used to describe machine frame distortion. It can be caused by a condition where the foot of a motor, pump or other component is not flat, square and tight to its mounting, or many other things, such as machining errors, bent or twisted feet and non-flat mounting surfaces. Soft foot increases vibration and puts undue stress on bearings, seals and couplings. Soft foot on a motor distorts the stator housing creating a non-uniform rotor to stator air gap resulting in vibration at two times line frequency.
A good laser shaft alignment system should be used to verify soft foot by loosening the machine feet one at a time.
Phase can be used to identify soft foot while the machine is in operation. Measure vertical phase between the foot and its mounting surface. If the joint is tight, the phase angle is the same between surfaces. If the phase angle is different by more than 20 degrees, the foot is loose or the machine frame is cracked or flimsy. Figure 8 is an example of the phase shift across a soft foot.
Figure 8. A phase shift between the foot and mount may indicate soft foot.
Cocked Bearings and Bent Shafts
Phase is used to detect cocked bearings and bent shafts. Measure phase at four axial locations around the bearing housing. If the bearing is cocked or the shaft is bent through the bearing, the phase will be different at each location. If the shaft is straight and the bearing is not twisting, the phase will be the same at each location (Figure 9).
Figure 9. Phase identifies in-plane or twisting bearing motion.
Confirm Imbalance
A once-per-revolution radial vibration usually means rotor unbalance. Use phase to prove imbalance is the problem. To confirm imbalance, measure the horizontal and vertical phase on a shaft or bearing housing. If the difference between the phase values is approximately 90 degrees, the problem is rotor unbalance (Figure 10). If the phase difference is closer to zero or 180 degrees, the vibration is caused by a reaction force. An eccentric pulley and shaft misalignment are examples of reaction forces.
Figure 10. Horizontal to Vertical Phase Shift of about 90 Degrees Confirms Unbalance
Looseness, Bending or Twisting
Phase is used to detect loose joints on structures and bending or twisting due to weakness or resonance. To check for looseness, measure the vertical phase at each mechanical joint as indicated by the arrows in Figure 11. When joints are loose, there will be a phase shift of approximately 180 degrees. The phase angle will not change across a tight joint.
Figure 11. A phase shift between bolted joints indicates looseness.
Shaft Misalignment
Shaft misalignment is easily verified with phase. Measure each bearing in the horizontal, vertical and axial directions. Record the values in a table or bubble diagram as shown in Figure 12. Compare the horizontal phase from bearing to bearing on each component and across the coupling. Repeat the comparison using vertical then axial data. Good alignment will show no substantial phase shift between bearings or across the coupling. The machine in Figure 12 has a 180-degree phase shift across the coupling in the radial directions. The axial directions are in-phase across the machine. The data indicates parallel (offset) shaft misalignment.
Figure 12. Phase Data Indicates Parallel Shaft Misalignment
Operational Deflection Shapes
Instead of comparing the phase and magnitude numbers from a table or bubble diagram, operational deflection shape software (ODS) can be used to animate a machine drawing. An ODS is a measurement technique used to analyze the motion of rotating equipment and structures during normal operation. An ODS is an extension of phase analysis where a computer-generated model of the machine is animated with phase and magnitude data or simultaneously measured time waveforms. The animation is visually analyzed to diagnose problems. ODS testing is able to identify a wide variety of mechanical faults and resonance issues such as looseness, soft foot, broken welds, misalignment, unbalance, bending or twisting from resonance, structural weakness and foundation problems.
Figure 13 is a simple ODS of three direct-coupled shafts. Phase and magnitude were measured from permanently mounted X and Y displacement probes on a turbine generator. The values listed in the table were used in ODS software to animate a stick figure drawing of the high- and low-pressure turbine shafts and the generator shaft. The picture to the right of the table is a capture from the ODS animation showing the vibration pattern of each shaft and the relative motion between shafts at 3,600 cycles per minute (turning speed).
Figure 13. Shaft Operational Deflection Shape
Many machines vibrate due to deteriorated foundations, looseness, resonance of the support structure and other problems that occur below the machine bearings. A phase study might include hundreds of test points measured all over the machine and foundation. Good ODS software can make it easier to analyze phase and magnitude data from a large number of test points. Analysis of an ODS involves observation and interpretation of the machine in motion. Figure 14 is an ODS structure drawing of a vertical pump.
Figure 14. Vertical Pump Operational Deflection Shape Structure Drawing
Conclusion
Condition-based vibration testing is a vital component of a reliability based maintenance program. Vibration sensors, instruments and software are able to provide key information about machine health. The weak link in the chain is the analyst’s ability to interpret the data, accurately diagnose the problem and trend the fault until it is time to recommend corrective action. Phase analysis is a very powerful diagnostic tool. Every vibration analyst should be using phase to improve vibration analysis accuracy.
About the author:
Tony DeMatteo is a vibration analyst and technical training instructor with 4X Diagnostics LLC, a service and training company providing consulting services, mentoring and training in diagnostic measurement, analysis, operational deflection shape testing and modal analysis. He can be reached at 585-293-3234 or www.4xdiagnostics.com. For more information about the featured VIBXPERT analyzer, visit www.ludeca.com/prod_vibxpert-vibration-analyzer.php.